Detección satelital de incendios y quemas en Patagonia
Estimación de AGB
LiDAR, SAR, Óptico
Deforestación en tiempo casi-real
Óptico
Humedales
SAR, Óptico
Apariciones
Dónde estuvimos.
Deforestación en tiempo casi-real
LAGIRS 2025
Reunión Argentina de Ecología
RAE
Publicaciones
Algunos de nuestros trabajos publicados.
“Near Real-Time Detection of EVI Time-Series Breakpoints Using Bayesian Inference for Deforestation Monitoring in the Chaco Forest”
“Validation of GEDI above ground biomass product over Pinus sp. plantations in Argentina”
“Enhanced CyGNSS Soil Moisture Retrieval Validated by In Situ Data in Argentina's Pampas”
“Validation of Saocom-Estimated Soil Dielectric Constant Using a Bayesian Inference Scheme in Agricultural Fields”
“Using SAOCOM Data and Bayesian Inference to Estimate Soil Dielectric Constant in Agricultural Soils”
“Estimación de la Constante Dieléctrica del Suelo Mediante Reflectometría GNSS y Método de Patrón de Interferencia”
Contactanos
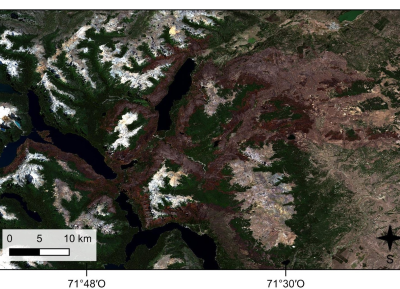
Detección satelital de incendios y quemas en Patagonia
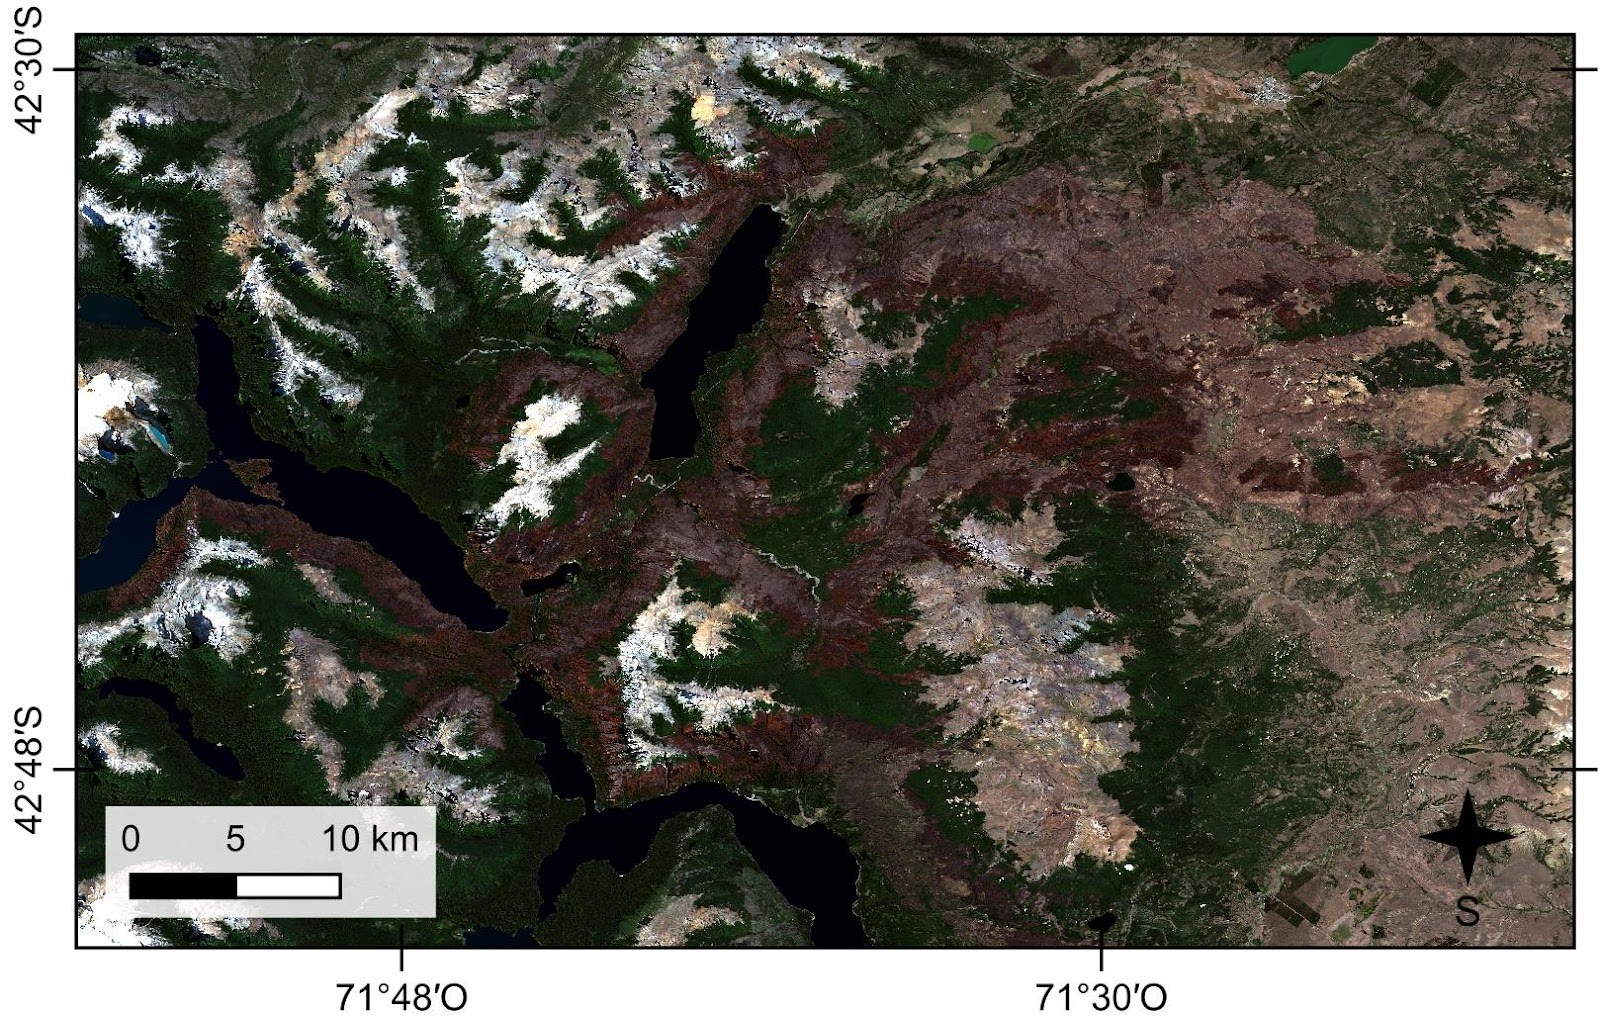
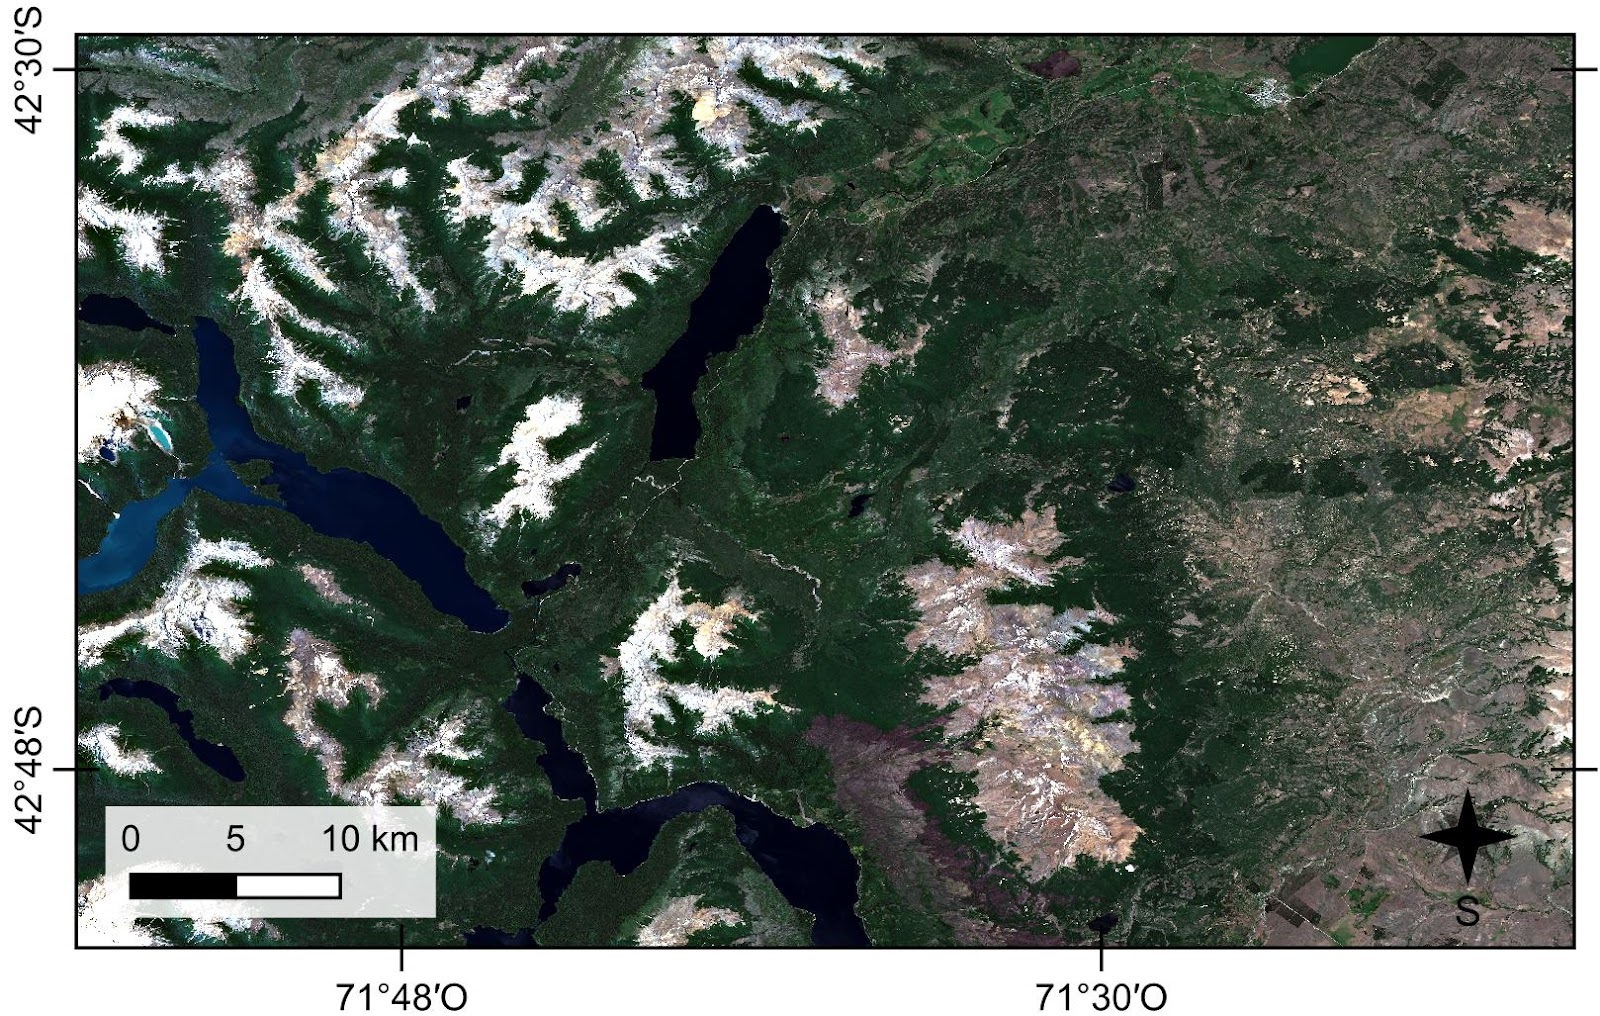
Los incendios en Patagonia son una problemática ambiental creciente, con un aumento sostenido en su frecuencia y magnitud en los últimos años. El fenómeno responde a múltiples causas (naturales y antrópicas) y sus efectos se ven agravados por el cambio climático y por el recorte presupuestario en las herramientas de prevención y manejo del fuego. En este contexto, desde Píxel aportamos a la identificación de las áreas de vegetación quemada durante el verano 2025-2026 y estimamos la severidad de los incendios en la zona del Parque y la Reserva Nacional Los Alerces y sus alrededores (provincia de Chubut, Argentina), a partir de información satelital. Los resultados muestran que la superficie de vegetación afectada por incendios (mayoritariamente bosques) alcanzó 42.500 ha, lo que equivale a cerca del 4% de la superficie del Parque Nacional y al 14% de la Reserva.
Nuestro enfoque combinó fuentes satelitales diversas, incluyendo datos ópticos multiespectrales y productos derivados del infrarrojo térmico. Para delimitar el área de vegetación afectada por los incendios utilizamos en primer lugar los focos de calor (potenciales incendios) registrados entre el 25 de noviembre de 2025 y el 10 de marzo de 2026, obtenidos del sistema FIRMS de la NASA. Luego, calculamos el Índice Normalizado de Área Quemada (NBR por sus siglas en inglés) en imágenes Sentinel-2 adquiridas por la European Space Agency, correspondientes al momento anterior (25/11/2025) y el posterior a los incendios (10/03/2026). El NBR se calcula como la relación entre los valores de la banda del infrarrojo cercano (NIR) y del infrarrojo de onda corta (SWIR) y permite resaltar las áreas afectadas por el fuego en incendios de gran extensión. A continuación, calculamos el diferencial del NBR (dNBR), el cual representa el cambio en la vegetación entre ambas fechas. Así, valores más altos de dNBR indican una mayor severidad del daño a la vegetación . Finalmente, para mejorar la estimación de la vegetación afectada eliminamos las zonas con sombras y nubes mediante la banda SCL de las imágenes Sentinel-2, así como las zonas no vegetadas a partir del mapa de coberturas y uso de suelo de MapBiomas del año 2024 (Proyecto MapBiomas Argentina).
El mapa final presenta las áreas de vegetación quemadas del Parque Nacional Los Alerces y su entorno, clasificadas de acuerdo al grado de severidad del incendio (de bajo a alto). La metodología desarrollada se puede replicar en otras áreas de interés y, en conjunto con conocimiento ecológico-ambiental, es posible analizar el impacto sobre distintos tipos de vegetación y áreas urbanas.
Si desea acceder a una versión rasterizada del mapa, puede descargarla aquí.
AntesDespués
Deslizá para comparar
Referencias - García, M. J .L., & Caselles, V. (1991). Mapping burns and natural reforestation using thematic mapper data. Geocarto International 6, 31–37. - Key, C., & Benson, N. (2005). Landscape assessment: Ground measure of severity, the Composite Burn Index; and remote sensing of severity, the Normalized Burn Index. En D. Lutes, R. Keane, J. Caratti, C. Key, N. Benson, S. Sutherland, & Gangi, L. (Eds.), FIREMON: Fire effects monitoring and inventory system. General Technical Report RMRS-GTR-164-CD LA. (pp. 1−51) Rocky Mountains Research Station: USDA Forest Service. - MapBiomas Argentina (2024). Proyecto MapBiomas Argentina- Colección 2 de los Mapas Anuales de Cobertura y Uso del Suelo en Argentina, accedido el 16 de marzo de 2026 a través del enlace: MapBiomas. - NASA's Fire Information for Resource Management System, 2021. MODIS Collection 61 NRT Hotspot Active Fire Detections MCD14DL distributed from NASA FIRMS. doi:10.5067/FIRMS/MODIS/MCD14DL.NRT.0061. Plataforma en línea: Fire Map - NASA | LANCE | FIRMS
Satellite detection of fires and burning in Patagonia
Wildfires in Patagonia are a growing environmental problem, with a sustained increase in their frequency and magnitude in recent years. The phenomenon stems from multiple causes (both natural and human-caused), and its effects are exacerbated by climate change and budget cuts to fire prevention and management tools. In this context, Píxel contributed to identifying the areas of vegetation burned during the summer of 2025-2026 and estimated the severity of the fires in the Los Alerces National Park and Reserve and its surroundings (Chubut Province, Argentina), using satellite data. The results show that the area of vegetation affected by fires (mostly forests) reached 42,500 hectares, equivalent to approximately 4% of the National Park's area and 14% of the Reserve's.
Our approach combined diverse satellite sources, including multispectral optical data and thermal infrared products. To delineate the area of vegetation affected by fires, we first used hotspots (potential fires) recorded between November 25, 2025, and March 10, 2026, obtained from NASA's FIRMS system. Next, we calculated the Normalized Burn Rate (NBR) on Sentinel-2 images acquired by the European Space Agency, corresponding to the time before (November 25, 2025) and after (March 10, 2026) the fires. The NBR is calculated as the ratio between near-infrared (NIR) and shortwave infrared (SWIR) band values and allows us to highlight the areas affected by fire in large-scale blazes. Finally, we calculated the differential NBR (dNBR), which represents the change in vegetation between these two dates. Thus, higher dNBR values indicate greater severity of vegetation damage. Finally, to improve the estimation of affected vegetation, we removed areas with shadows and clouds using the SCL band of Sentinel-2 images, as well as non-vegetated areas from the 2024 MapBiomas land cover and land use map (MapBiomas Argentina Project).
The final map shows the burned vegetation areas of Los Alerces National Park and its surroundings, classified according to the severity of the fire (from low to high). The methodology developed can be replicated in other areas of interest and, combined with ecological and environmental knowledge, can be used to analyze the impact on different types of vegetation and urban areas.
If you want to access a raster version of the map, you can download it here.
BeforeAfter
Slide to compare
References - García, M. J .L., & Caselles, V. (1991). Mapping burns and natural reforestation using thematic mapper data. Geocarto International 6, 31–37. - Key, C., & Benson, N. (2005). Landscape assessment: Ground measure of severity, the Composite Burn Index; and remote sensing of severity, the Normalized Burn Index. En D. Lutes, R. Keane, J. Caratti, C. Key, N. Benson, S. Sutherland, & Gangi, L. (Eds.), FIREMON: Fire effects monitoring and inventory system. General Technical Report RMRS-GTR-164-CD LA. (pp. 1−51) Rocky Mountains Research Station: USDA Forest Service. - MapBiomas Argentina (2024). Proyecto MapBiomas Argentina- Colección 2 de los Mapas Anuales de Cobertura y Uso del Suelo en Argentina, accedido el 16 de marzo de 2026 a través del enlace: MapBiomas. - NASA's Fire Information for Resource Management System, 2021. MODIS Collection 61 NRT Hotspot Active Fire Detections MCD14DL distributed from NASA FIRMS. doi:10.5067/FIRMS/MODIS/MCD14DL.NRT.0061. Plataforma en línea: Fire Map - NASA | LANCE | FIRMS
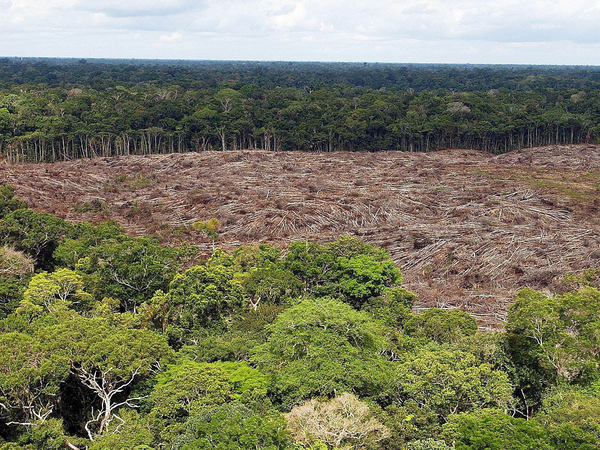
Estimar la biomasa forestal mediante teledetección es crucial en el contexto del secuestro de carbono, ya que es la única manera de cuantificar sistemática y periódicamente la cantidad de carbono almacenado en los ecosistemas forestales. Los bosques actúan como sumideros de carbono al absorber dióxido de carbono (CO₂) de la atmósfera durante la fotosíntesis y almacenarlo en su biomasa. Entre los sistemas satelitales más utilizados, clasificados en función del error en la estimación de la biomasa aérea (AGBD), se encuentran el lidar, el SAR y los sensores ópticos (cada uno con sus propios desafíos). El desarrollo de algoritmos de estimación precisos es un tema abierto. Sin embargo, las estimaciones de estos instrumentos se utilizan regularmente para monitorear la deforestación, la degradación forestal y los procesos de regeneración natural, como insumo para la toma de decisiones en políticas de conservación, reforestación y gestión sostenible. Estos datos son esenciales para cumplir con los compromisos internacionales relacionados con el clima, como el Acuerdo de París y los mecanismos REDD+ (Reducción de Emisiones por Deforestación y Degradación Forestal).
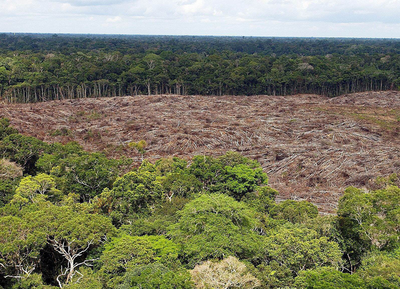
La deforestación representa una amenaza significativa para los ecosistemas naturales, en particular en la región del Chaco argentino, una de las áreas forestales con mayor cambio del mundo. Este estudio se centra en la detección de eventos repentinos de deforestación, donde la cubierta forestal se elimina rápidamente en pocos meses. El monitoreo de estos cambios en vastas áreas requiere el uso de índices de vegetación satelitales, como el EVI y el NDVI de MODIS. Sin embargo, la identificación precisa de los eventos de deforestación es un desafío debido a la variabilidad estacional, el ruido de los sensores, la falta de datos y las inconsistencias algorítmicas. Estos factores pueden ocultar las verdaderas señales de deforestación o generar falsos positivos. Para abordar estos problemas, un enfoque de detección robusto debe modelar explícitamente la dinámica de las series temporales (capturando tendencias, estacionalidad e incertidumbre) para distinguir de manera confiable los puntos de quiebre de la deforestación genuina de la variación natural y el ruido. En este artículo, se propusieron tres modelos para la detección de puntos de quiebre en series temporales de EVI: un detector simple de anomalías de z-score y dos modelos completamente bayesianos; uno no correlacionado temporalmente y otro completamente correlacionado. Los resultados indican que los esquemas bayesianos mejoran significativamente con respecto al enfoque ingenuo (z-score: AUC=0,921, F1-score=0,870, Bayes: AUC=0,959, F1-score=0,925), por un coste razonable en tiempo de cálculo (x1000).
Estimating forest biomass through remote sensing is crucial in the context of carbon sequestration, as it is the only way to systematically and periodically quantify the amount of carbon stored in forest ecosystems. Forests act as carbon sinks by absorbing carbon dioxide (CO₂) from the atmosphere during photosynthesis and storing it in their biomass.
Among the most widely used satellite systems, ranked in terms of error in aboveground biomass estimation (AGBD), are lidar, SAR, and optical sensors (each with its own challenges). The development of accurate estimation algorithms is an open issue. However, estimates from these instruments are regularly used to monitor deforestation, forest degradation, and natural regeneration processes, as input for decision-making in conservation, reforestation, and sustainable management policies. These data are essential for meeting international climate-related commitments, such as the Paris Agreement and REDD+ (Reducing Emissions from Deforestation and Forest Degradation) mechanisms.
Deforestation poses a significant threat to natural ecosystems, particularly in Argentina’s Chaco region—one of the world’s most rapidly changing forest areas. This study focuses on the detection of sudden deforestation events, where forest cover is rapidly removed within a few months. Monitoring such changes across vast areas requires the use of satellite-based vegetation indices, such as EVI and NDVI from MODIS. However, accurately identifying deforestation events is challenging due to seasonal variability, sensor noise, data gaps, and algorithmic inconsistencies. These factors can obscure true deforestation signals or generate false positives. To address these issues, a robust detection approach must explicitly model time-series dynamics—capturing trends, seasonality, and uncertainty—to reliably distinguish genuine deforestation breakpoints from natural variation and noise. In this paper, three models for the detection of breakpoints in EVI time series were proposed: a simple z-score anomaly detector, and two fully Bayesian models; one temporally uncorrelated and one fully correlated. Results indicate that the Bayesian schemes significantly improve over the naive approach (zscore: AUC=0.921, F1-score=0.870, Bayes: AUC=0.959, F1-score=0.925), for a reasonable cost in computing time (x1000).
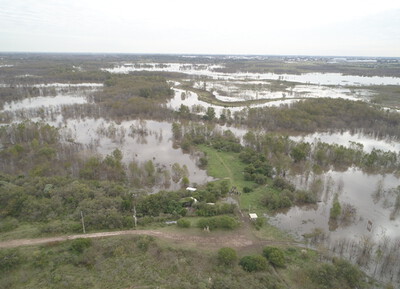
Tras la convocatoria PROSAT II de la Comisión Nacional de Actividades Espaciales (CONAE), se desarrolló un sistema que utiliza información satelital polarimétrica de microondas activa de la Misión SAOCOM argentina, junto con otros datos satelitales ópticos y de radar, para el monitoreo de humedales en Argentina (en consonancia con el uso de información satelital para programas de inventario de humedales). El trabajo se llevó a cabo en unidades piloto de paisaje de humedales: el Sitio Ramsar del Alto Delta (provincia de Entre Ríos), Concepción del Uruguay (provincia de Entre Ríos) y Bajo de los Saladillos (provincia de Santa Fe). El primer objetivo fue desarrollar un catálogo de coeficientes de retrodispersión (microondas activa, bandas C y L) y respuestas espectrales (visible e infrarrojo reflexivo) asociadas a los tipos de humedales en las áreas de estudio. El catálogo es un panel interactivo que muestra gráficos para cada tipo de humedal, lo que permite a los usuarios visualizar las firmas espectrales o la retrodispersión característica (valores medios y desviación o rango de variación) para un período seleccionado, así como la dinámica temporal de la retrodispersión o los índices sintéticos derivados de datos satelitales ópticos. El panel se diseñó con dos modalidades: a) exploratoria, en la que cada usuario puede obtener gráficos filtrando libremente por tipo de escena, fecha y tipo de humedal; b) guiada, en la que se accede a gráficos prediseñados, acompañados de una interpretación realizada por los consultores (por ejemplo, diferencias entre períodos secos y húmedos, o análisis de las diferencias entre tipos de humedales). Resulta útil para los gestores que participan en el mapeo de humedales, ya que proporciona un resumen e interpretación de la información SAR y óptica.
Following the PROSAT II call from the National Commission for Space Activities (CONAE), a system was developed using active microwave polarimetric satellite information from the Argentine SAOCOM Mission, together with other optical and radar satellite data, for monitoring wetlands in Argentina (in line with the use of satellite information for wetland inventory programs). Work was carried out in pilot wetland landscape units: the Ramsar Site in the Upper Delta (Entre Ríos Province), Concepción del Uruguay (Entre Ríos Province), and Bajo de los Saladillos (Santa Fe Province). The first objective was to develop a catalog of backscatter coefficients (active microwave, C and L bands) and spectral responses (visible and reflective infrared) associated with the wetland types in the study areas.
The catalog is an interactive dashboard that displays graphs for each wetland type, allowing users to view spectral signatures or characteristic backscatter (mean values and deviation or range of variation) for a selected period, as well as the temporal dynamics of backscatter or synthetic indices derived from optical satellite data. The dashboard was designed with two modalities: a) exploratory, in which each user can obtain graphs by freely filtering by scene type, date, and wetland type; b) guided, in which pre-built graphs are accessed, accompanied by an interpretation made by the consultants (for example, differences between dry and wet periods, or analysis of differences between wetland types). It is useful for managers involved in wetland mapping, as it provides a summary and interpretation of SAR and optical information.
La deforestación representa una amenaza significativa para los ecosistemas naturales, en particular en la región del Chaco argentino, una de las áreas forestales con mayor cambio del mundo. Este estudio se centra en la detección de eventos repentinos de deforestación, donde la cubierta forestal se elimina rápidamente en pocos meses. El monitoreo de estos cambios en vastas áreas requiere el uso de índices de vegetación satelitales, como el EVI y el NDVI de MODIS. Sin embargo, la identificación precisa de los eventos de deforestación es un desafío debido a la variabilidad estacional, el ruido de los sensores, la falta de datos y las inconsistencias algorítmicas. Estos factores pueden ocultar las verdaderas señales de deforestación o generar falsos positivos. Para abordar estos problemas, un enfoque de detección robusto debe modelar explícitamente la dinámica de las series temporales (capturando tendencias, estacionalidad e incertidumbre) para distinguir de manera confiable los puntos de quiebre de la deforestación genuina de la variación natural y el ruido. En este artículo, se propusieron tres modelos para la detección de puntos de quiebre en series temporales de EVI: un detector simple de anomalías de z-score y dos modelos completamente bayesianos; uno no correlacionado temporalmente y otro completamente correlacionado. Los resultados indican que los esquemas bayesianos mejoran significativamente con respecto al enfoque ingenuo (z-score: AUC=0,921, F1-score=0,870, Bayes: AUC=0,959, F1-score=0,925), por un coste razonable en tiempo de cálculo (x1000).
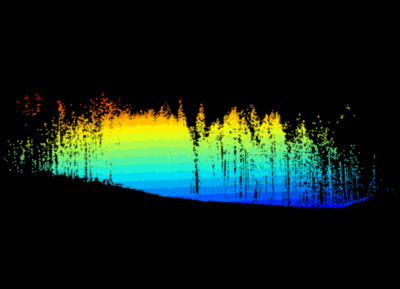
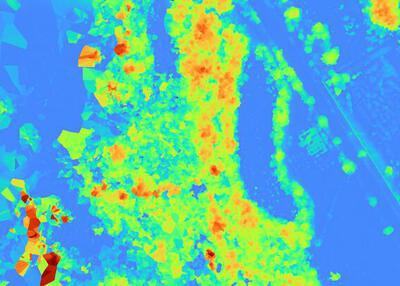
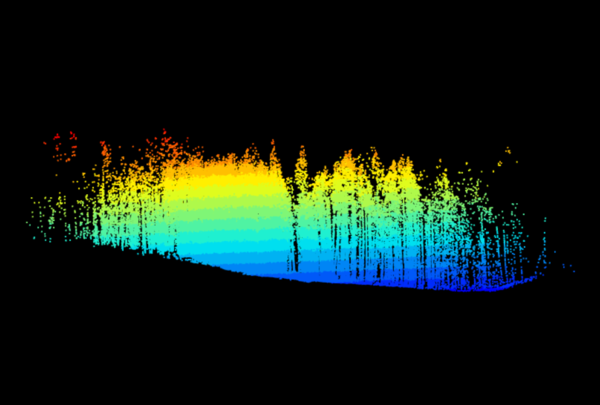
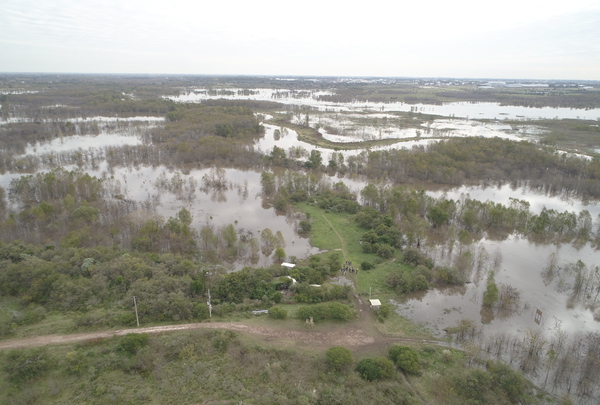
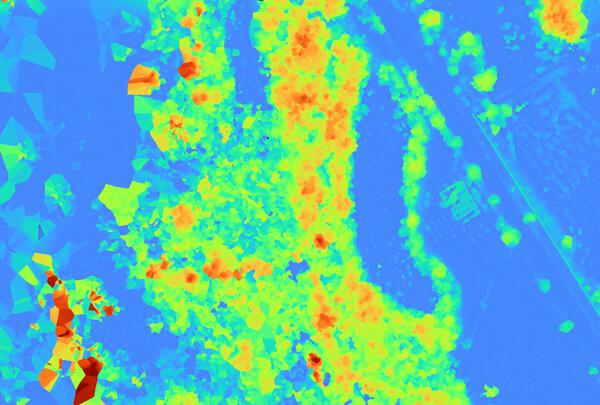
La Reserva Natural Municipal del Pilar (Buenos Aires) protege un sector de la planicie de inundación del río Luján, con diversas comunidades vegetales. Nuestro objetivo fue evaluar la factibilidad de estimar la altura de la vegetación a partir de información obtenida con un Vehículo Aéreo No Tripulado (VANT). En mayo de 2025 realizamos vuelos automatizados en grillas sobre ambientes de talar (12 ha) y pastizal (13 ha) con el VANT DJI Phantom 4 Pro, equipado con una cámara RGB de 20 megapíxeles. Las fotografías fueron procesadas mediante técnicas fotogramétricas digitales que permiten generar nubes de puntos densas. Obtuvimos ortomosaicos georreferenciados, modelos de elevación de superficie y de elevación del terreno (DTM). A campo, geolocalizamos individuos vegetales con un GNSS Diferencial (dGNSS) y medimos la altitud del terreno. Asimismo, con un telémetro láser estimamos la altura de individuos vegetales de *Celtis tala*, *Phytolacca dioica*, *Solanum granulosum-leprosum*, *Salix humboldtiana*, *Morus* sp., *Baccharis* sp. y *Cortaderia selloana*. La consistencia entre los DTM obtenidos con las mediciones dGNSS y con información VANT fue baja en zonas de alta densidad arbórea. Las estimaciones de altura de la vegetación mostraron muy buen ajuste con las mediciones a campo, independientemente del DTM utilizado (correlación de Pearson, r = 0.98 a 0.95). Sin embargo, los sesgos en la altura de los individuos fueron mayores al usar el DTM elaborado con VANT. Los resultados destacan el potencial de la adquisición de datos con VANT y de la fotogrametría para caracterizar la estructura de la vegetación.
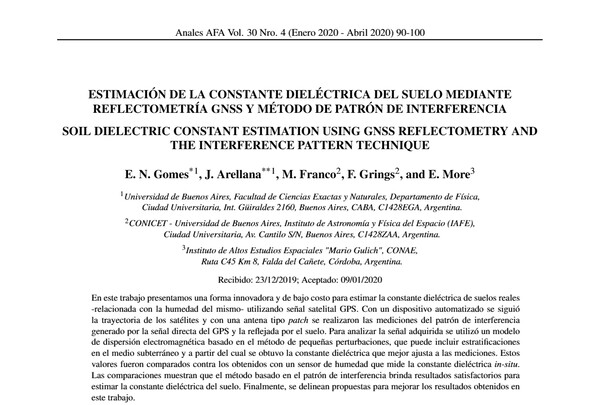
“Estimación de la Constante Dieléctrica del Suelo Mediante Reflectometría GNSS y Método de Patrón de Interferencia”
E. N. Gomes, J. Arellana, M. Franco, F. Grings, and E. More, Enero 2020
En este trabajo presentamos una forma innovadora y de bajo costo para estimar la constante dieléctrica de suelos reales - relacionada con la humedad del mismo - utilizando señal satelital GPS. Con un dispositivo automatizado se siguió la trayectoria de los satélites y con una antena tipopatchse realizaron las mediciones del patrón de interferencia generado por la señal directa del GPS y la reflejada por el suelo. Para analizar la señal adquirida se utilizó un modelode dispersión electromagnética basado en el método de pequeñas perturbaciones, que puede incluir estratificaciones en el medio subterráneo y a partir del cual se obtuvo la constante dieléctrica que mejor ajusta a las mediciones. Estos valores fueron comparados contra los obtenidos con un sensor de humedad que mide la constante dieléctrica in-situ. Las comparaciones muestran que el método basado en el patrón de interferencia brinda resultados satisfactorios para estimar la constante dieléctrica del suelo. Finalmente, se delinean propuestas para mejorar los resultados obtenidos eneste trabajo.
“Using SAOCOM Data and Bayesian Inference to Estimate Soil Dielectric Constant in Agricultural Soils”
J. Arellana, F. Grings and M. Franco, July 2023
Soil moisture is a key geophysical variable that can be estimated using remote-sensing techniques by making use of the known relation between soil backscattering and the dielectric constant in the microwave regime. However, since SAR system observations depend on geometrical and dielectric surface parameters (besides instrument parameters like operation frequency, incidence angle, and received/transmitted polarization), the uncertainties associated with a given retrieval scheme are difficult to evaluate. In this letter, these uncertainties associated with the estimation of soil dielectric constant from a single quad-pol SAR image are studied using a physically based interaction model (i.e., a two-layer version of the small perturbation method (SPM) model at second order) coupled with a Bayesian approach. The overall scheme was validated using SAOCOM quad-pol data and in situ soil dielectric constant measurements in experimental agricultural plots in Argentina. Both theoretical end-to-end experiments and actual retrieval from real SAR data were implemented. From the simulations, the intrinsic ambiguities in the estimations of soil dielectric constant from a single image were studied, and the benefits of using two images with different incidence angles were discussed. Finally, by analyzing SAOCOM data using the proposed retrieval scheme, soil dielectric constants were estimated and compared with in situ measurements, with a root-mean-square error (RMSE) of ≤2.
“Validation of Saocom-Estimated Soil Dielectric Constant Using a Bayesian Inference Scheme in Agricultural Fields”
J. Arellana, F. Grings and M. Franco, November 2024
In this study, the estimation of soil moisture from a single quad-pol Synthetic Aperture Radar (SAR) image from SAOCOM mission along with a physically based interaction model (two-layer version of the small perturbation method model at the second order) was validated with in-situ measured data in the central region of Argentina. The relationship between microwave backscattering and dielectric constant (ϵ) allows for precise estimation of ϵ effectively disambiguating the influence of soil roughness in bare soil conditions. Measured dielectric constants from the study area are used for validation.
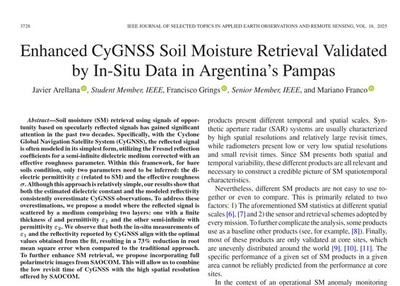
“Enhanced CyGNSS Soil Moisture Retrieval Validated by In Situ Data in Argentina's Pampas”
J. Arellana, F. Grings, M. Franco, April 2025
Soil moisture (SM) retrieval using signals of opportunity based on specularly reflected signals has gained significant attention in the past two decades. Specifically, with the Cyclone Global Navigation Satellite System (CyGNSS), the reflected signal is often modeled in its simplest form, utilizing the Fresnel reflection coefficients for a semi-infinite dielectric medium corrected with an effective roughness parameter. Within this framework, for bare soils condition, only two parameters need to be inferred: the dielectric permittivity ε (related to SM) and the effective roughness σ. Although this approach is relatively simple, our results show that both the estimated dielectric constant and the modeled reflectivity consistently overestimate CyGNSS observations. To address these overestimations, we propose a model where the reflected signal is scattered by a medium comprising two layers: one with a finite thickness d and permittivity ε1 and the other semi-infinite with permittivity ε2. We observe that both the in-situ measurements of ε1 and the reflectivity reported by CyGNSS align with the optimal values obtained from the fit, resulting in a 73% reduction in root mean square error when compared to the traditional approach. To further enhance SM retrieval, we propose incorporating full polarimetric images from SAOCOM. This will allow us to combine the low revisit time of CyGNSS with the high spatial resolution offered by SAOCOM.
“Validation of GEDI above ground biomass product over Pinus sp. plantations in Argentina”
F. Grings, A. Leszczuk, E. Hildt, D. Lorán, J. Arellana, et. al., April 2025
In recent years, in addition to the traditional uses of forest plantations, there has been an interest in their capacity to capture and fix carbon in their structures, acting as greenhouse gas sinks. The Global Ecosystem Dynamics Investigation (GEDI) project features a light detection and ranging sensor aimed at quantifying the distribution of biomass and carbon in woody vegetation worldwide. Although the GEDI level 4A product (L4A) generates aboveground biomass density (AGBD) estimates on a global scale using semi-empirical relationships between the energy reflected at a given height (rh metric) and AGBD, its forest segmentation is coarse and presents limitations at a local scale, which can result in less accurate estimates. We evaluated the accuracy of GEDI L4A AGBD estimates and in situ AGBD data obtained from forest inventories. The analysis of the relationship between in situ AGBD and GEDI L4A product AGBD estimates shows that, although the correlation is generally good, some plots exhibit high variability in GEDI AGBD values despite having intermediate values of in situ AGBD [root mean squared error (RMSE) = 89.1 Mg/h]. Moreover, we found that these underestimations are associated with low values of rh50. In particular, these low values of rh50 (related to large AGBD RMSE errors) were not related to thinned/non-thinned forests but were related to understory conditions (less error for the “very dense” understories). Then, we explored landcover misassignment; as the Pinus sp. plantations correspond to implanted North American evergreen needleleaf forests (ENFs), we reconstructed the L4A product for this region and South America, using the corresponding expressions to estimate AGBD. The results show an improvement in the overall correlation and a reduction in errors, with RMSE reducing to 68.4 Mg/h for South American ENF and 64.2 Mg/h for North American ENF. Finally, we discuss ways to improve AGBD estimations (or flag wrong ones) using all available values of the rh curve.
“Near Real-Time Detection of EVI Time-Series Breakpoints Using Bayesian Inference for Deforestation Monitoring in the Chaco Forest”
F. Grings, F. González Bianco, E. Roitberg, N. Morandeira, J. Arellana, M. Gayol., March 2026
Deforestation poses a significant threat to natural ecosystems, particularly in Argentina’s Chaco region—one of the world’s most rapidly changing forest areas. This study focuses on the detection of sudden deforestation events, where forest cover is rapidly removed within a few months. Monitoring such changes across vast areas requires the use of satellite-based vegetation indices, such as the Enhanced Vegetation Index (EVI) and Normalized Difference Vegetation Index (NDVI) from MODIS. However, accurately identifying deforestation events is challenging due to seasonal variability, sensor noise, data gaps, and algorithmic inconsistencies. These factors can obscure true deforestation signals or generate false positives. To address these issues, a robust detection approach must explicitly model time-series dynamics, capturing trends, seasonality, and uncertainty, to reliably distinguish genuine deforestation breakpoints from natural variation and noise. In this paper, three models for the detection of breakpoints in EVI time series were proposed: a simple z-score anomaly detector, and two fully Bayesian models; one temporally uncorrelated and one fully correlated. Results indicate that the Bayesian schemes significantly improve over the naive approach (zscore: AUC=0.921, F1-score=0.870, Bayes: AUC=0.959, F1-score=0.925), for a reasonable cost in computing time ×1000.